
IST718 LAB6
PRETTY GRAPHS
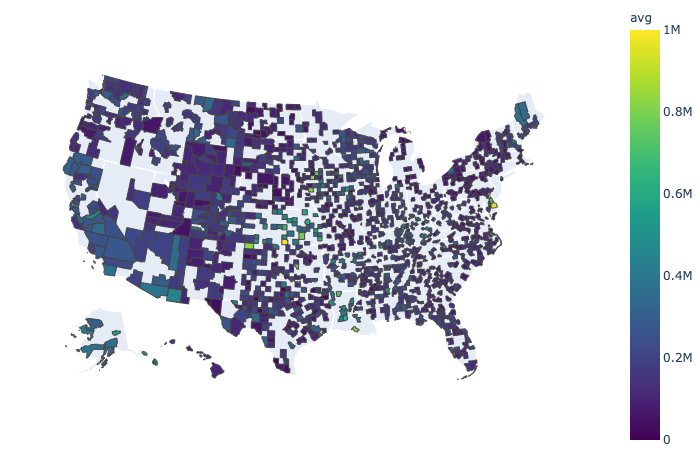
Average Home Value by State
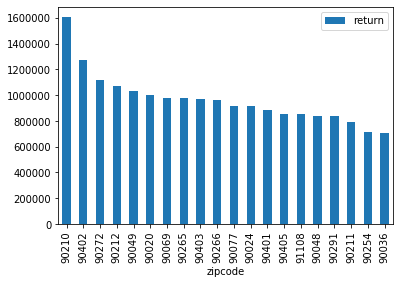
Largest Home Value Averages, by State
(number is the price of the highest zip code average )
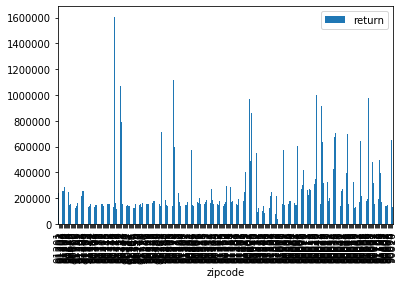
THE BIG DF (all 30k)
2-24-20
Finally Getting to play with the BIG df
In an effort to avoid what happened last time, I’m going to address all clear questions upfront
Before going on side quests
2-6-20
Struggling getting them on all one plot while telling the whole story
PLOTS
2-12-20
Struggling with prophet and monthly vs daily graphs
2-12-20 AFTERNOON
GOAL: Graphs for each state
COMPONENT GRAPHS FOR EACH STATE, labeled
GOAL: Graphs for each zip code in Glendale
(BIG GOAL: Practicing small so I can loop and make big)
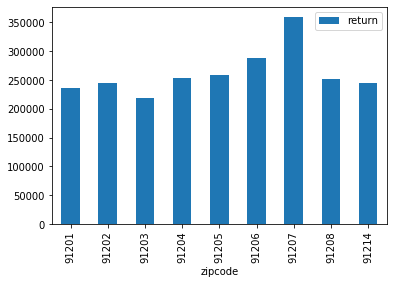
Where to invest in Glendale?
2-13-20
“NIGHT FILE” (file to be run at night)
ALL CODE FILES FROM PROJECT:
NOTES TO SELF:
MESSY – https://colab.research.google.com/github/2SUBDA/Breakouts/blob/Week4/TimeForRetailProphet.ipynb CLEANER – https://colab.research.google.com/drive/12hsScBfd9wlKGXS6yrfwYHPhCDmcu_Qa#scrollTo=HUA4-hBYgnre INSTRUCTIONS – file:///Users/danielcaraway/Documents/IST_718Big_Data/laboratory_exercise-_2.pdf
RESOURCES: http://financeandpython.com/SeabornDataVisualization/6/2.html https://matplotlib.org/gallery/recipes/common_date_problems.html
jupyter nbconvert –to html IST718_LAB6_i2.ipynb